It’s amazing how fast the VDI market is changing and exciting because with these changes customers will finally realize some really great cost reduction and business agility benefits that have thus far been elusive. As the industry transitions to cloud deployments, we believe it will be helpful for IT execs to have a framework for comparing virtual desktop solutions in the market, but that’s easier said than done. Where to start? On-prem VDI? Virtual apps? Desktop-as-a-Service (DaaS)? And what constitutes a “real” desktop cloud service?
VDI and DaaS solutions can be evaluated through the lens of people in the “food chain” of virtual app and desktop evaluation, selection, deployment, use and management:
- Who is the primary sponsor? CIO or the Application Owner?
- Who are the end users? E-Staff, Power-Users, Knowledge Users, Remote Developers, Field Users, Contractors, Partners, Others?
- What does the solution do for the CFO and CISO? Does it increase or decrease security, agility and cost?
- Who are the people managing the solution? Generic IT Staff, VDI Specialists, Datacenter Specialists, Cloud Experts, Security Ninjas or Expensive Consultants?
Each has her/his special interests and goals when it comes to participating in the decision-making process, and from those special interests, we can derive a framework for evaluation.
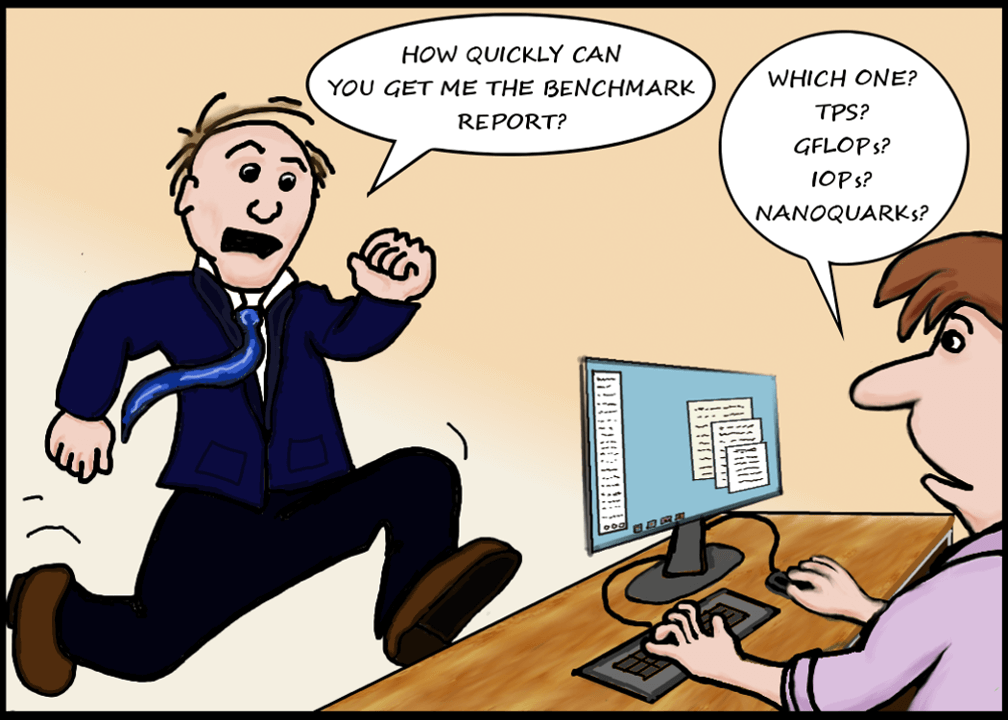
But before I dive into that, let me ask a question: Does anyone know why the VDI vendors never agreed on a common benchmark for comparing the various protocols in the market?
Where’s the benchmark?
Let’s look at the database industry. The term transaction is commonly understood in the technology world. A typical transaction, as defined by the Transaction Processing Council (TPC), would include “an update to a database system for things like airline reservations (services), e-commerce (goods) or banking (money)”. TPC produces benchmarks that measure transaction processing and database performance in terms of how many transactions a given system and database can perform per unit of time, e.g., transactions per second or transactions per minute. How do you compare two full stack systems in the market to run your database? You look at the TPC score and the cost of the full system and make a judgment based on your needs. All the vendors in the industry use the same framework to present the results. It’s super helpful to buyers to be able to compare apples to apples.
As the database industry evolved, a single benchmark was not sufficient to capture the “quality” of the software for all possible use-cases. If you look at the TPC website, you will notice that there are several “flavors” of TPC benchmark; each measure different parameters:
- TPC-C (the benchmark is centered around the principal activities of an order-entry environment)
- TPC-DI (Data Integration, also known as ETL, is the analysis, combination, and transformation of data from a variety of sources and formats into a unified data model representation)
- TPC-DS (PC-DS is the de-facto industry standard benchmark for measuring the performance of decision support solutions including, but not limited to, Big Data systems)
- TPCx-V (The TPCx-V benchmark was developed to measure the performance of servers running database workloads in virtual machines)
and there are more!
The primary reason for not having a standard benchmark in the VDI industry is that there is no standard definition of a what a “transaction” could mean for a remote user experience.

What does it all mean?
Remote protocols transfer graphical frames or bitmaps from a machine running in the datacenter to a client device. There are various techniques of sending updates to the client side. For example, it could be commands or raw bitmaps. If the number of frames transferred is used as a metric, all vendors can compromise the quality of the frames. Unless a frame is captured on the client side and the quality of the frame is observed, it is impossible to quantify whether the fidelity of the frame has changed between the server and the client. An Excel sheet with heavy text and a web page full of pictures may require different encoding schemes. Does it really matter if the server is sending 30 frames/sec to the client but the client is showing lossy frames to the end user or dropping frames on the client side? The quality of the frame is one dimension for evaluating remote protocols.
The amount of bandwidth used is another vector. If hundreds of users are on a T1 line in a branch office, the density of users the line can accommodate is an important cost factor for the deployment. At the same time, if your deployment has all the users connecting from home or if your business depends on already-provisioned big bandwidth pipes, incremental 200-300Kbps traffic per user is not a problem. For instance, does it really matter if the client is using only 200Kbps for the remote protocol traffic but the client has 1Mbps bandwidth available and the rest of the bandwidth is not utilized? Should the extra bandwidth be used to improve the user experience?
The experience is also dependent on the latency between the client and the server. The user experience will degrade as the latency increases between the end user and the virtual desktop. VDI is generally not recommended by specialists when the round trip latency goes beyond 300ms. It may work but end users will never be happy. With modern cloud options and easy multi-region deployments, putting desktops closer to the end users will always result in better performance by reducing the latency between the end users and the virtual desktops.
If you combine the above three vectors (quality of frames, bandwidth used, latency), you will notice that capturing a TPS-like score for a generic workload will be challenging. Every business use-case will place a different weight on each vector. A call center use-case can not be compared with a hospital kiosk workload. Contractors accessing virtual desktops for security reasons should not be benchmarked with a trader using a Bloomberg application workload. There is no one-size-fits-all.
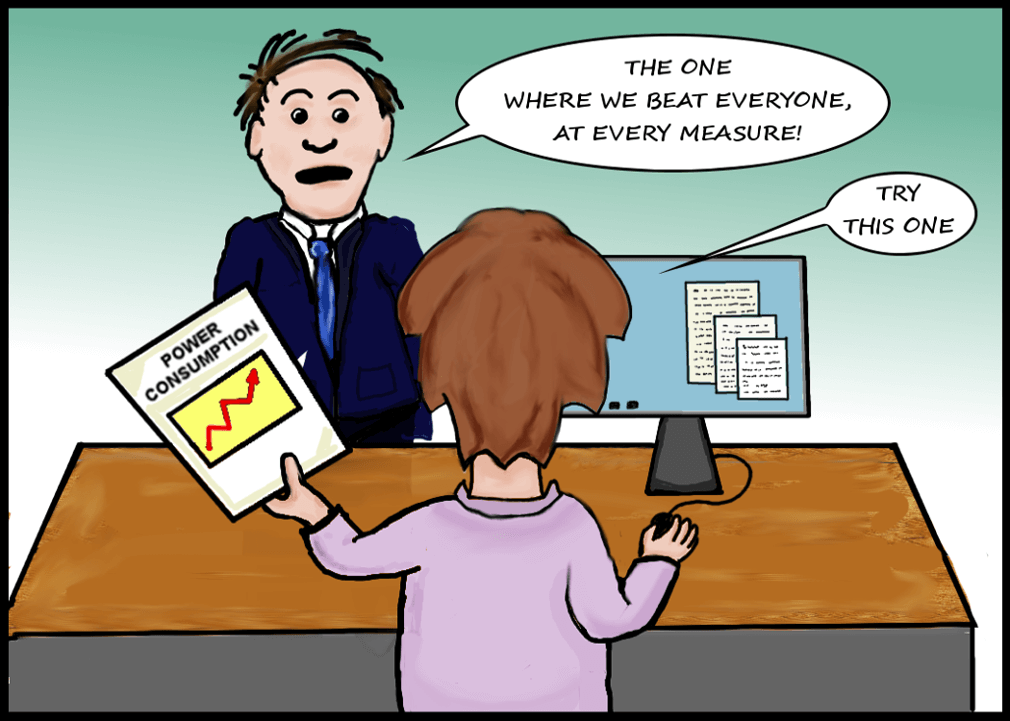
Let us consider what’s happening in the industry. You will find a lot of home grown micro-benchmarks and misleading results on the web comparing various protocols. A typical example is a benchmark with a video streaming workload. The benchmark author will compare the total amount of bandwidth used by the various clients. Based on the results, the author will describe that protocol A is better than protocol B because it uses less bandwidth. The author uses his magical insights to describe the quality of the frames and how sluggish or smooth the experience was when he was running the videos simultaneously. The author adds a disclaimer that the best test is with your own workload and the results are not reviewed by any third party.
Such results do not capture anything meaningful for buyers! It just adds confusion because it fails to connect the benchmarking exercise with business goals. It only focuses on one small part of what can be done inside a remote desktop session.
The key point is that benchmarking requires a scientific model to capture the frames on the client side and a well defined methodology agreed upon by experienced professionals. For example, this study sponsored by Microsoft compares RDP10 and PCoIP protocols and uses REX Analyzer to visualize the test results. Such studies take months of effort and the analysis does not provide a single score. It provides commentary on what the author observed in various network conditions. The above study says:
RDP 10 uses more aggressive compression algorithms which causes slight degradation of color quality under LAN conditions. Under the different WAN conditions, RDP 10 shows better quality in terms of frame rate and stuttering. This means that RDP 10 is better suited for network constrained connections than PCoIP.
It’s impossible to provide a definitive transactions-per-second-like score for comparing remote protocols. Even though the above study shows that RDP 10 is better suited than PCoIP for the common network constrained VDI use-cases, it is only capturing the experience of the end user in the overall system. The buyer will always need to consider the operational aspects of the solution before picking up a virtual desktop solution vendor. For instance:
- Who are the people in the solution food chain? Remote protocol performance is an important metric for the end users. What about the IT staff responsible for setting up, managing and monitoring the solution? What about the CIO? What about the CISO?
- What does the business demand to stay competitive? Agility to move to new countries, address new use-cases such as disaster recovery, the ability to acquire new companies and roll out VDI quickly?
- Cost of the solution? There is a market for Audi. There is also a market for Honda.
- Support and overall vendor engagement? It is unreasonable to assume that the solution will not break after the initial deployment. Plan for the worst-case scenario.
A scoring framework
With all that considered, here is a suggestion for a a simple framework to evaluate the overall “fitness” of the various cloud desktop products in the market. You’ll want to establish the following scores to compare the products:
- CIO Score:
- Overall security
- Cost
- CapEx/OpEx
- Service reliability
- Solution agility
- Thought-leadership/innovation provided by the vendor
- End User Score:
- Performance for typical business applications when inside the desktop
- Login speed
- Flexibility: support for different client OS’s and form-factors
- Performance in good network conditions
- Performance in average network conditions
- Performance in poor network conditions
- Performance for 3D apps (GPU use-cases)
- Performance under load (when 100’s of users are active on the same server and storage infrastructure)
- IT Staff Score:
- What skills are required to deploy the solution
- Does the solution offer easy multi-site deployments
- What skills are required to monitor, maintain and upgrade the solution components
- How to troubleshoot issues reported by end users
- How to troubleshoot security alarms or events
- Scalability of the solution
- Availability of the solution. Historical uptime of the service.
- Does the solution provide elasticity? How easy is it to add more users? Add more infrastructure capacity? Add more cloud locations?
- Does the solution provide single pane of glass management? Is the solution a suite of badly assembled products or is it a coherent software-as-a-service offering?
A “sum of parts” evaluation methodology is always more comprehensive and meaningful than a single, magical score that is often misleading or irrelevant.
If you were looking at transportation options for your employees, you would want to understand the difference between “horsepower” and “mileage”. Why is the cloud desktop market growing so rapidly? Because CIO’s want the best mileage!
Cloud PCs|IT Strategy